
(Maumee, OH – June 21, 2023) – Existing-home sales slid for the second consecutive month, falling 3.4% nationwide as of last measure, according to the National Association of REALTORS® (NAR), as higher interest rates continue to impact buyer affordability.
Sales are down 23% compared to the same period a year ago, while contract signings dropped 20.3% year-over-year.
With sales cooling, buyers in some parts of the country have found relief in the form of declining sales prices, which are down 1.7% year-over-year nationally, although more affordable markets continue to see price gains.
Locally, New Listings decreased 11.3 percent for Single Family homes and increased 24.1 percent for Condo-Villa homes.
Pending Sales decreased 12.3 percent for Single Family homes but increased 5.9 percent for Condo-Villa homes. Inventory decreased 20.1 percent for Single Family homes and 25.0 percent for Condo-Villa homes.
Median Sales Price increased 2.6 percent to $175,000 for Single Family homes and 12.4 percent to $219,950 for Condo-Villa homes.
Days on Market decreased 8.3 percent for Single Family homes and 37.9 percent for Condo-Villa homes.
Months Supply of Inventory remained unchanged for Single Family homes and decreased 33.3 percent for Condo-Villa homes.
While fluctuating interest rates have pushed some buyers to the sidelines, a shortage of inventory is also to blame for lower-than-average home sales this time of year, as current homeowners, many of whom locked in mortgage rates several percentage points below today’s current rates, are delaying the decision to sell until market conditions improve. With only 2.9 months’ supply heading into May, available homes are moving fast, with the typical home spending just over three weeks on the market, according to NAR.
| Single Family Homes | 2022 YTD | 2023 YTD | % Change |
| Sales | 3,444 | 2920 | -15.2% |
| New Listings | 4325 | 3750 | -13.3% |
| Average Days On Market | 65 | 64 | -1.5% |
| Average Price Per Square Foot | $110.92 | $111.87 | 0.9% |
| Average Sales Price | $ 197,595 | $ 192,716 | -2.5% |
| Total Volume | $ 680,515,700 | $ 562,669,477 | -17.3% |
| Median Sales Price | $ 161,000 | $ 162,000 | 0.6% |
| Condo Villas | 2022 YTD | 2023 YTD | % Change |
| Sales | 262 | 239 | -8.8% |
| New Listings | 335 | 300 | -10.4% |
| Average Days On Market | 70 | 55 | -21.4% |
| Average Price Per Square Foot | $127.44 | 134.49 | 5.5% |
| Total Volume | $ 55,530,524 | $ 52,022,096 | -6.3% |
| Average Sales Price | $ 211,949 | $ 217,666 | 2.7% |
| Median Sales Price | $ 204,950 | $ 215,000 | 4.9% |
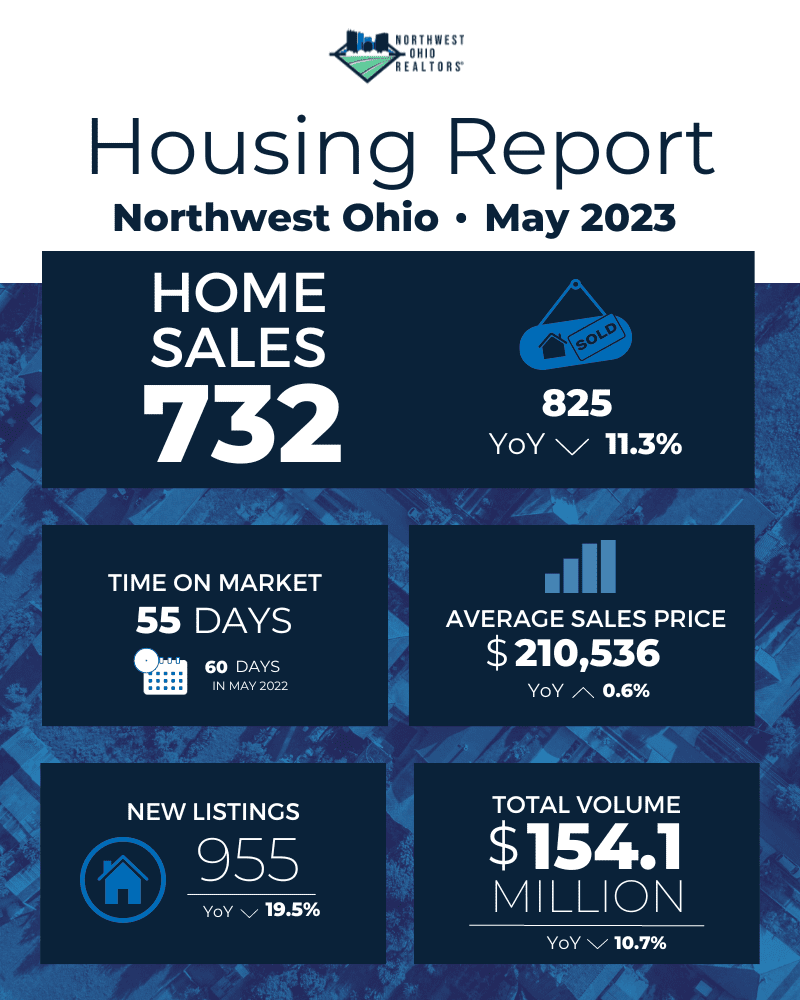
| Single Family Homes | May-22 | May-23 | % Change |
| Sales | 825 | 732 | -11.3% |
| Months of Inventory | 4 | 4 | 0.0% |
| New Listings | 1186 | 955 | -19.5% |
| Average Days On Market | 60 | 55 | -8.3% |
| Average Price Per Square Foot | $117.37 | $118.93 | 1.3% |
| Average Sales Price | $ 209,220 | $ 210,536 | 0.6% |
| Total Volume | $ 172,606,247 | $ 154,111,195 | -10.7% |
| Median Sales Price | $ 170,600 | $ 175,000 | 2.6% |
| Condo Villas | May-22 | May-23 | % Change |
| Sales | 58 | 72 | 24.1% |
| New Listings | 80 | 70 | -12.5% |
| Months of Inventory | 3 | 2 | -33.3% |
| Average Days On Market | 66 | 41 | -37.9% |
| Average Price Per Square Foot | $127.37 | 140.85 | 10.6% |
| Total Volume | $ 11,909,502 | $ 16,193,693 | 36.0% |
| Average Sales Price | $ 202,336 | $ 224,912 | 11.2% |
| Median Sales Price | $ 195,618 | $ 219,950 | 12.4% |